Opinion polling for the Finnish parliamentary election, 2019
In the run up to the 2019 parliamentary elections in the Finland, various organisations carry out opinion polling to gauge voting intention in Finland. Results of such polls are displayed in this article.
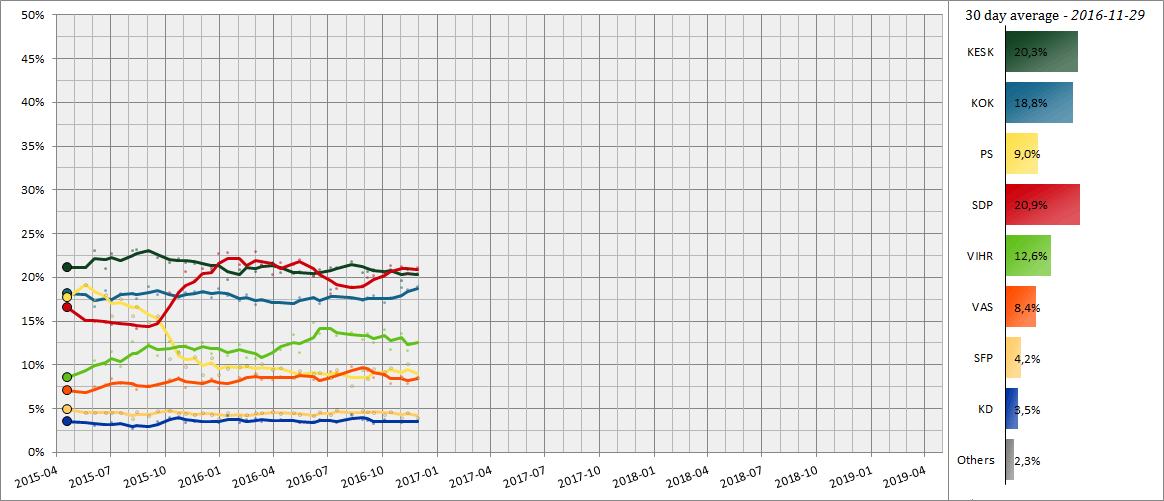
The date range for these opinion polls are from the previous parliamentary election, held on 19 April 2015, to the present day.
Graphical summary
Poll results
Poll results are listed in the table below in reverse chronological order, showing the most recent first. The highest percentage figure in each poll is displayed in bold, and the background shaded in the leading party's colour. In the instance that there is a tie, then no figure is shaded. The table uses the date the survey's fieldwork was done, as opposed to the date of publication. However, if that date is unknown, the date of publication will be given instead.
The Sipilä Cabinet is composed of the top three parties from the previous election: Centre (Kesk), National Coalition (Kok) and Finns (PS) parties.
| Date | Polling Firm | KESK | KOK | PS | SDP | VIHR | VAS | SFP | KD | Others | Lead | Govt-Opposition |
|---|---|---|---|---|---|---|---|---|---|---|---|---|
| 2–29 Nov | Taloustutkimus | 20.4 | 18.9 | 8.5 | 21.1 | 12.6 | 8.6 | 4.0 | 3.6 | 2.3 | 0.7 | 47.8 – 49.9 |
| 17 Oct–11 Nov | TNS Gallup | 20.9 | 18.6 | 10.1 | 20.4 | 11.6 | 7.9 | 4.6 | 3.5 | 2.4 | 0.5 | 49.6 – 48.0 |
| 5 Oct–1 Nov | Taloustutkimus | 19.6 | 18.8 | 8.5 | 21.2 | 13.6 | 8.7 | 4.0 | 3.4 | 2.2 | 1.6 | 47.1 – 50.9 |
| 19 Sep–14 Oct | TNS Gallup | 20.9 | 17.7 | 9.7 | 21.3 | 11.8 | 7.9 | 4.7 | 3.5 | 2.4 | 0.4 | 48.3 – 49.2 |
| 12 Sep–04 Oct | Taloustutkimus | 20.5 | 17.1 | 9.2 | 20.5 | 14.0 | 8.8 | 4.3 | 3.8 | 1.8 | 0 | 46.8 – 51.4 |
| 22 Aug–15 Sep | TNS Gallup | 20.9 | 17.9 | 9.6 | 20.2 | 12.6 | 8.6 | 4.6 | 3.3 | 2.3 | 0.7 | 48.4 – 49.3 |
| 15 Aug–06 Sep | Taloustutkimus | 20.7 | 17.7 | 8.4 | 20.0 | 13.6 | 9.3 | 4.7 | 3.6 | 2.0 | 0.7 | 46.8 – 51.2 |
| 18 Jul–18 Aug | TNS Gallup | 20.6 | 17.3 | 9.5 | 19.1 | 12.9 | 9.6 | 4.8 | 3.7 | 2.5 | 1.5 | 47.4 – 50.1 |
| 11 Jul–09 Aug | Taloustutkimus | 21.8 | 17.6 | 7.6 | 18.9 | 13.7 | 9.8 | 4.3 | 4.3 | 2.0 | 2.9 | 47.0 – 50.8 |
| 20 Jun–15 Jul | TNS Gallup | 21.1 | 17.8 | 9.5 | 18.7 | 13.3 | 9.0 | 4.9 | 3.4 | 2.3 | 2.4 | 48.4 – 49.3 |
| 08 Jun–05 Jul | Taloustutkimus | 21.1 | 18.6 | 8.6 | 18.2 | 14.1 | 9.2 | 4.3 | 3.6 | 2.3 | 2.5 | 48.3 – 49.4 |
| 16 May–16 Jun | TNS Gallup | 20.9 | 17.0 | 9.1 | 20.6 | 13.6 | 8.2 | 4.7 | 3.7 | 2.2 | 0.3 | 47.0 – 50.8 |
| 9 May–7 Jun | Taloustutkimus | 20.2 | 17.7 | 9.0 | 20.1 | 14.8 | 8.3 | 4.2 | 3.5 | 2.2 | 0.1 | 46.9 – 50.9 |
| 12–14 May | TNS Gallup | 20.7 | 17.7 | 9.3 | 22.0 | 11.4 | 9.0 | 4.3 | 3.4 | 2.2 | 1.3 | 47.7 – 50.1 |
| 4 Apr–3 May | Taloustutkimus | 20.4 | 17.0 | 8.5 | 21.5 | 13.5 | 8.5 | 4.5 | 3.6 | 2.5 | 1.1 | 45.9 – 51.6 |
| 14 Mar–11 Apr | TNS Gallup | 20.6 | 17.1 | 9.7 | 21.7 | 11.7 | 8.7 | 4.4 | 3.7 | 2.4 | 1.1 | 47.4 – 50.2 |
| 7–30 Mar | Taloustutkimus | 21.7 | 17.1 | 9.5 | 20.3 | 12.5 | 8.3 | 4.7 | 3.6 | 2.3 | 1.4 | 48.3 – 49.4 |
| 15 Feb–11 Mar | TNS Gallup | 21.5 | 17.4 | 10.2 | 21.4 | 10.9 | 8.3 | 4.5 | 3.5 | 2.3 | 0.1 | 49.1 – 48.6 |
| 3 Feb–1 Mar | Taloustutkimus | 20.7 | 16.9 | 9.0 | 22.9 | 10.7 | 8.9 | 4.5 | 3.9 | 2.5 | 2.2 | 46.6 – 50.9 |
| 18 Jan–14 Feb | TNS Gallup | 21.4 | 18.0 | 9.9 | 21.2 | 10.8 | 8.5 | 4.3 | 3.7 | 2.2 | 0.2 | 49.3 – 48.5 |
| 11 Jan–2 Feb | Taloustutkimus | 20.9 | 17.3 | 9.8 | 21.5 | 12.3 | 8.6 | 4.1 | 3.4 | 2.1 | 0.6 | 48.0 – 49.9 |
| 14 Dec–14 Jan | TNS Gallup | 19.7 | 17.9 | 9.6 | 22.8 | 11.1 | 7.9 | 4.5 | 4.2 | 2.3 | 3.1 | 47.2 – 50.5 |
| 2016 | ||||||||||||
| 7–29 Dec | Taloustutkimus | 21.4 | 18.7 | 8.9 | 22.7 | 11.7 | 7.3 | 3.9 | 3.4 | 2.0 | 1.3 | 49.0 – 49.0 |
| 16 Nov–10 Dec | TNS Gallup | 20.9 | 17.7 | 10.8 | 21.1 | 11.3 | 8.4 | 4.3 | 3.5 | 2.0 | 0.2 | 49.4 – 48.6 |
| 9 Nov–1 Dec | Taloustutkimus | 21.6 | 18.3 | 8.9 | 21.0 | 12.6 | 8.1 | 4.6 | 3.5 | 1.4 | 0.6 | 48.8 – 49.8 |
| 19 Oct–12 Nov | TNS Gallup | 21.6 | 18.4 | 11.0 | 19.6 | 11.6 | 8.0 | 4.3 | 3.5 | 2.0 | 2.0 | 51.0 – 47.0 |
| 12 Oct–3 Nov | Taloustutkimus | 21.7 | 18.3 | 9.8 | 20.7 | 12.2 | 7.4 | 4.4 | 3.4 | 2.1 | 1.0 | 49.8 – 48.1 |
| 14 Sep–16 Oct | TNS Gallup | 22.2 | 17.7 | 11.4 | 18.3 | 11.5 | 8.6 | 4.4 | 3.9 | 2.0 | 3.9 | 51.3 – 46.7 |
| 7 Sep–6 Oct | Taloustutkimus | 21.7 | 18.0 | 10.7 | 18.3 | 12.7 | 8.3 | 4.8 | 4.0 | 1.5 | 3.7 | 50.4 – 48.1 |
| 10 Aug–10 Sep | TNS Gallup | 22.3 | 18.0 | 15.6 | 15.0 | 11.1 | 7.8 | 4.8 | 3.5 | 1.9 | 4.3 | 55.9 – 42.2 |
| 10 Aug–1 Sep | Taloustutkimus | 23.0 | 18.9 | 15.0 | 14.4 | 12.4 | 7.6 | 4.2 | 2.9 | 1.6 | 4.1 | 56.9 – 41.5 |
| 13 Jul–7 Aug | TNS Gallup | 23.2 | 17.6 | 16.7 | 14.2 | 11.4 | 7.2 | 4.7 | 3.1 | 1.9 | 5.6 | 57.5 – 40.6 |
| 7 Jul–4 Aug | Taloustutkimus | 23.1 | 18.2 | 15.6 | 14.5 | 12.7 | 7.8 | 3.9 | 2.7 | 1.5 | 4.9 | 56.9 – 41.6 |
| 15 Jun–9 Jul | TNS Gallup | 21.9 | 18.2 | 17.6 | 14.7 | 9.8 | 7.9 | 4.5 | 3.3 | 2.1 | 3.7 | 57.7 – 40.2 |
| 3 Jun–1 Jul | Taloustutkimus | 22.7 | 17.3 | 15.6 | 14.6 | 11.5 | 8.4 | 4.5 | 3.4 | 2.0 | 5.4 | 55.6 – 42.4 |
| 18 May–11 Jun | TNS Gallup | 21.0 | 18.5 | 18.0 | 14.8 | 10.0 | 7.8 | 4.5 | 3.2 | 2.2 | 2.5 | 57.5 – 40.4 |
| 4 May–2 Jun | Taloustutkimus | 23.1 | 16.7 | 17.5 | 15.0 | 10.5 | 7.5 | 4.5 | 3.1 | 2.1 | 5.6 | 57.3 – 40.6 |
| 20 Apr–15 May | TNS Gallup | 21.1 | 18.0 | 19.2 | 15.1 | 9.3 | 6.8 | 4.6 | 3.4 | 2.5 | 1.9 | 58.3 – 39.2 |
| 19 Apr 2015 | Election Results | 21.1 | 18.2 | 17.7 | 16.5 | 8.5 | 7.1 | 4.9 | 3.5 | 2.5 | 2.9 | 57.0 – 40.5 |