| Rank |
Subdivision |
Province |
Type |
Land Area (2011) |
Population (2011) |
Population (2006) |
Population (2001) |
Population (1996) |
Change (2006–2011) |
Change (1996–2011) |
| 1 |
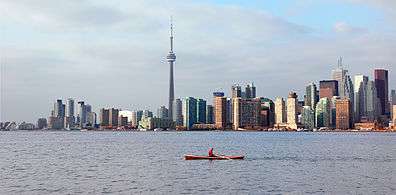
Toronto |
Ontario |
City |
630.2 km2 |
2,615,060 |
2,503,281 |
2,481,494 |
2,385,421 |
7000446529974062039♠+4.47% |
7000962677028499370♠+9.63% |
| 2 |
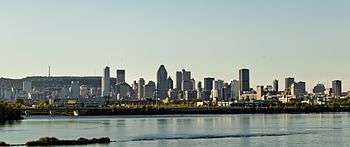
Montreal |
Quebec |
Ville |
365.1 km2 |
1,649,519 |
1,620,693 |
1,583,590 |
1,547,030 |
7000177862186114210♠+1.78% |
7000662488768802160♠+6.62% |
| 3 |
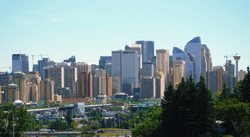
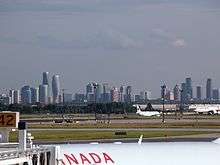
Calgary |
Alberta |
City |
825.3 km2 |
1,096,833 |
988,193 |
879,003 |
768,082 |
7001109938038419620♠+10.99% |
7001428015498345230♠+42.80% |
| 4 |
Ottawa |
Ontario |
City |
2,790.2 km2 |
883,391 |
812,129 |
774,072 |
721,136 |
7000877471436188090♠+8.77% |
7001224999167979410♠+22.50% |
| 5 |
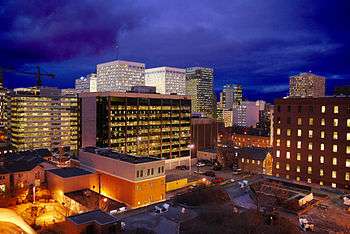
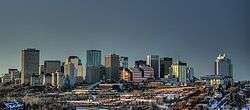
Edmonton |
Alberta |
City |
684.4 km2 |
812,201 |
730,372 |
666,104 |
616,306 |
7001112037427502700♠+11.20% |
7001317853468893700♠+31.79% |
| 6 |
Mississauga |
Ontario |
City |
292.4 km2 |
713,443 |
668,549 |
612,000 |
544,382 |
7000671513980276690♠+6.72% |
7001310555822933160♠+31.06% |
| 7 |
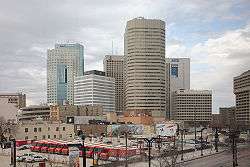
Winnipeg |
Manitoba |
City |
464.1 km2 |
663,617 |
633,451 |
619,544 |
618,477 |
7000476216787091660♠+4.76% |
7000729857375456160♠+7.30% |
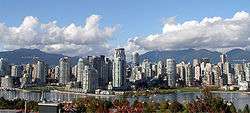
| 8 |
Vancouver |
British Columbia |
City |
115.0 km2 |
603,502 |
578,041 |
545,671 |
514,008 |
7000440470485657590♠+4.40% |
7001174110130581630♠+17.41% |
| 9 |
Brampton |
Ontario |
City |
266.3 km2 |
523,911 |
433,806 |
325,428 |
268,251 |
7001207708053830510♠+20.77% |
7001953062616728360♠+95.31% |
| 10 |
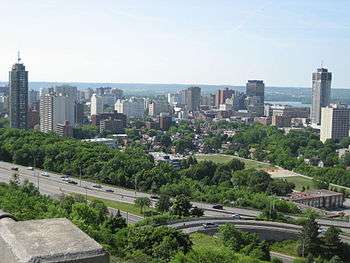
Hamilton |
Ontario |
City |
1,117.2 km2 |
519,949 |
504,559 |
490,268 |
467,799 |
7000305018838232990♠+3.05% |
7001111479502948920♠+11.15% |
| 11 |
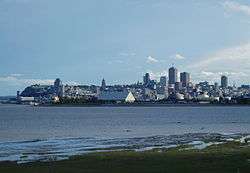
Quebec City |
Quebec |
Ville |
454.1 km2 |
516,622 |
491,142 |
476,330 |
467,728 |
7000518790899576900♠+5.19% |
7001104535114425480♠+10.45% |
| 12 |
Surrey |
British Columbia |
City |
316.4 km2 |
468,251 |
394,976 |
347,820 |
304,477 |
7001185517601069430♠+18.55% |
7001537886277124380♠+53.79% |
| 13 |
Laval |
Quebec |
Ville |
247.1 km2 |
401,553 |
368,709 |
343,005 |
330,393 |
7000890783788841610♠+8.91% |
7001215379865796190♠+21.54% |
| 14 |
Halifax |
Nova Scotia |
Regional municipality |
5,490.3 km2 |
390,096 |
372,679 |
359,111 |
342,851 |
7000467345892846119♠+4.67% |
7001137800385590240♠+13.78% |
| 15 |
London |
Ontario |
City |
420.6 km2 |
366,151 |
352,395 |
336,539 |
325,669 |
7000390357411427520♠+3.90% |
7001124304124740150♠+12.43% |
| 16 |
Markham |
Ontario |
City |
212.6 km2 |
301,709 |
261,573 |
208,615 |
173,383 |
7001153440913244100♠+15.34% |
7001740130231914320♠+74.01% |
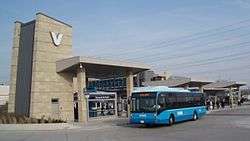
| 17 |
Vaughan |
Ontario |
City |
273.5 km2 |
288,301 |
238,866 |
182,022 |
132,549 |
7001206957038674400♠+20.70% |
7002117505224483020♠+117.51% |
| 18 |
Gatineau |
Quebec |
Ville |
343.0 km2 |
265,349 |
242,124 |
226,696 |
217,591 |
7000959219243032500♠+9.59% |
7001219485180912810♠+21.95% |
| 19 |
Longueuil |
Quebec |
Ville |
115.6 km2 |
231,409 |
229,330 |
225,761 |
225,722 |
6999906553874329560♠+0.91% |
7000251947085352780♠+2.52% |
| 20 |
Burnaby |
British Columbia |
City |
90.6 km2 |
223,218 |
202,799 |
193,954 |
179,209 |
7001100685900818050♠+10.07% |
7001245573604004260♠+24.56% |
| 21 |
Saskatoon |
Saskatchewan |
City |
209.6 km2 |
222,189 |
202,340 |
196,861 |
193,653 |
7000980972620342000♠+9.81% |
7001147356353890720♠+14.74% |
| 22 |
Kitchener |
Ontario |
City |
136.8 km2 |
219,153 |
204,668 |
190,399 |
178,420 |
7000707731545722830♠+7.08% |
7001228298397040689♠+22.83% |
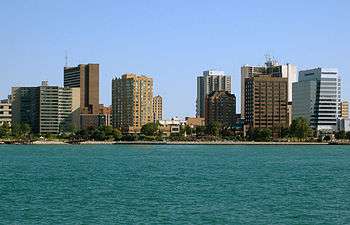
| 23 |
Windsor |
Ontario |
City |
146.3 km2 |
210,891 |
216,473 |
209,218 |
197,694 |
2999742138742475970♠−2.58% |
7000667546814774350♠+6.68% |
| 24 |
Regina |
Saskatchewan |
City |
145.5 km2 |
193,100 |
179,246 |
178,225 |
180,404 |
7000772904276803950♠+7.73% |
7000703753797033330♠+7.04% |
| 25 |
Richmond |
British Columbia |
City |
129.3 km2 |
190,473 |
174,461 |
164,345 |
148,867 |
7000917798247172720♠+9.18% |
7001279484371956180♠+27.95% |
| 26 |
Richmond Hill |
Ontario |
Town |
101.0 km2 |
185,541 |
162,704 |
132,030 |
101,725 |
7001140359179860360♠+14.04% |
7001823946915704100♠+82.39% |
| 27 |
Oakville |
Ontario |
Town |
138.9 km2 |
182,520 |
165,613 |
144,738 |
128,405 |
7001102087396520800♠+10.21% |
7001421439975078850♠+42.14% |
| 28 |
Burlington |
Ontario |
City |
185.7 km2 |
175,779 |
164,415 |
150,836 |
136,976 |
7000691177812243410♠+6.91% |
7001283283202896860♠+28.33% |
| 29 |
Greater Sudbury |
Ontario |
City |
3,227.4 km2 |
160,274 |
157,857 |
155,219 |
165,336 |
7000153113260735980♠+1.53% |
2999693835583297040♠−3.06% |
| 30 |
Sherbrooke |
Quebec |
Ville |
353.5 km2 |
154,601 |
147,427 |
138,785 |
136,883 |
7000486613713905870♠+4.87% |
7001129439009957410♠+12.94% |
| 31 |
Oshawa |
Ontario |
City |
145.7 km2 |
149,607 |
141,590 |
139,051 |
134,464 |
7000566212303128750♠+5.66% |
7001112617503569730♠+11.26% |
| 32 |
Saguenay |
Quebec |
Ville |
1,126.5 km2 |
144,746 |
143,692 |
147,133 |
152,811 |
6999733513347994320♠+0.73% |
2999472223858230100♠−5.28% |
| 33 |
Lévis |
Quebec |
Ville |
449.3 km2 |
138,769 |
130,006 |
121,999 |
103,750 |
7000674045813270160♠+6.74% |
7001337532530120480♠+33.75% |
| 34 |
Barrie |
Ontario |
City |
77.4 km2 |
135,711 |
128,430 |
103,710 |
79,191 |
7000566923615977570♠+5.67% |
7001713717467894079♠+71.37% |
| 35 |
Abbotsford |
British Columbia |
City |
375.6 km2 |
133,497 |
123,864 |
115,494 |
105,403 |
7000777707808564230♠+7.78% |
7001266538903067280♠+26.65% |
| 36 |
St. Catharines |
Ontario |
City |
96.1 km2 |
131,400 |
131,989 |
129,170 |
130,926 |
3000553750691345489♠−0.45% |
6999362036570276340♠+0.36% |
| 37 |
Trois-Rivières |
Quebec |
Ville |
288.9 km2 |
131,338 |
126,323 |
122,395 |
124,417 |
7000396998171354390♠+3.97% |
7000556274464100570♠+5.56% |
| 38 |
Cambridge |
Ontario |
City |
113.0 km2 |
126,748 |
120,371 |
110,372 |
101,429 |
7000529778767311060♠+5.30% |
7001249622888917370♠+24.96% |
| 39 |
Coquitlam |
British Columbia |
City |
122.3 km2 |
126,456 |
114,565 |
112,890 |
101,820 |
7001103792606817090♠+10.38% |
7001241956393635829♠+24.20% |
| 40 |
Kingston |
Ontario |
City |
451.2 km2 |
123,363 |
117,207 |
114,195 |
112,605 |
7000525224602626120♠+5.25% |
7000955374983348870♠+9.55% |
| 41 |
Whitby |
Ontario |
Town |
146.5 km2 |
122,022 |
111,184 |
87,413 |
73,794 |
7000974780543963160♠+9.75% |
7001653549069030000♠+65.35% |
| 42 |
Guelph |
Ontario |
City |
87.2 km2 |
121,688 |
114,943 |
106,170 |
95,821 |
7000586812594068360♠+5.87% |
7001269951263293010♠+27.00% |
| 43 |
Kelowna |
British Columbia |
City |
211.6 km2 |
117,312 |
106,707 |
96,288 |
89,442 |
7000993842953133349♠+9.94% |
7001311598577849330♠+31.16% |
| 44 |
Saanich |
British Columbia |
District municipality |
103.8 km2 |
109,752 |
108,265 |
103,654 |
101,388 |
7000137348173463260♠+1.37% |
7000824949698189130♠+8.25% |
| 45 |
Ajax |
Ontario |
Town |
67.1 km2 |
109,600 |
90,167 |
73,753 |
64,430 |
7001215522308605140♠+21.55% |
7001701070929691140♠+70.11% |
| 46 |
Thunder Bay |
Ontario |
City |
328.2 km2 |
108,359 |
109,140 |
109,016 |
113,662 |
3000284405350925419♠−0.72% |
2999533441255652720♠−4.67% |
| 47 |
Terrebonne |
Quebec |
Ville |
154.7 km2 |
106,322 |
94,703 |
80,536 |
75,116 |
7001122688827175490♠+12.27% |
7001415437456733590♠+41.54% |
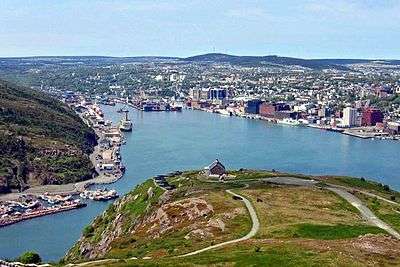
| 48 |
St. John's |
Newfoundland and Labrador |
City |
446.0 km2 |
106,172 |
100,646 |
99,182 |
101,936 |
7000549053116865049♠+5.49% |
7000415554857950090♠+4.16% |
| 49 |
Langley |
British Columbia |
District municipality |
308.0 km2 |
104,177 |
93,726 |
86,896 |
80,179 |
7001111505878838320♠+11.15% |
7001299305304381450♠+29.93% |
| 50 |
Chatham-Kent |
Ontario |
Municipality |
2,458.1 km2 |
103,671 |
108,177 |
107,341 |
109,950 |
2999583460439834720♠−4.17% |
2999428922237380630♠−5.71% |
| 51 |
Delta |
British Columbia |
District municipality |
180.1 km2 |
99,863 |
96,723 |
96,950 |
95,411 |
7000324638400380470♠+3.25% |
7000466612864344780♠+4.67% |
| 52 |
Waterloo |
Ontario |
City |
64.0 km2 |
98,780 |
97,475 |
86,543 |
77,949 |
7000133880482174919♠+1.34% |
7001267238835648950♠+26.72% |
| 53 |
Cape Breton |
Nova Scotia |
Regional municipality |
2,433.4 km2 |
97,398 |
102,250 |
105,968 |
114,733 |
2999525476772616139♠−4.75% |
2998848910078181520♠−15.11% |
| 54 |
Brantford |
Ontario |
City |
72.5 km2 |
93,650 |
90,192 |
86,417 |
86,417 |
7000383404293063690♠+3.83% |
7000836988092620670♠+8.37% |
| 55 |
Strathcona County |
Alberta |
Specialized municipality |
1,180.6 km2 |
92,490 |
82,511 |
71,986 |
64,176 |
7001120941450230880♠+12.09% |
7001441192969334330♠+44.12% |
| 56 |
Saint-Jean-sur-Richelieu |
Quebec |
Ville |
225.8 km2 |
92,394 |
87,492 |
79,600 |
76,461 |
7000560279797010009♠+5.60% |
7001208380743123950♠+20.84% |
| 57 |
Red Deer |
Alberta |
City |
104.3 km2 |
90,564 |
82,772 |
67,829 |
60,080 |
7000941381143381820♠+9.41% |
7001507390146471370♠+50.74% |
| 58 |
Pickering |
Ontario |
City |
231.6 km2 |
88,721 |
87,838 |
87,139 |
78,989 |
7000100525968259750♠+1.01% |
7001123207028826799♠+12.32% |
| 59 |
Kamloops |
British Columbia |
City |
299.2 km2 |
85,678 |
80,376 |
77,281 |
76,394 |
7000659649646660690♠+6.60% |
7001121527868680790♠+12.15% |
| 60 |
Clarington |
Ontario |
Municipality |
611.3 km2 |
84,548 |
77,820 |
69,834 |
60,615 |
7000864559239270110♠+8.65% |
7001394836261651410♠+39.48% |
| 61 |
North Vancouver |
British Columbia |
District municipality |
160.8 km2 |
84,412 |
82,562 |
82,310 |
80,418 |
7000224074029214410♠+2.24% |
7000496654977741300♠+4.97% |
| 62 |
Milton |
Ontario |
Town |
363.2 km2 |
84,362 |
53,939 |
31,471 |
32,104 |
7001564026029403590♠+56.40% |
7002162777224021930♠+162.78% |
| 63 |
Nanaimo |
British Columbia |
City |
91.3 km2 |
83,810 |
78,692 |
73,000 |
70,130 |
7000650383774716620♠+6.50% |
7001195066305432770♠+19.51% |
| 64 |
Lethbridge |
Alberta |
City |
122.4 km2 |
83,517 |
74,637 |
67,374 |
63,053 |
7001118975843080510♠+11.90% |
7001324552360712420♠+32.46% |
| 65 |
Niagara Falls |
Ontario |
City |
209.7 km2 |
82,997 |
82,184 |
78,815 |
76,917 |
6999989243648398720♠+0.99% |
7000790462446533280♠+7.90% |
| 66 |
Repentigny |
Quebec |
Ville |
61.8 km2 |
82,000 |
76,237 |
72,218 |
70,677 |
7000755932158925460♠+7.56% |
7001160207705477029♠+16.02% |
| 67 |
Victoria |
British Columbia |
City |
19.5 km2 |
80,017 |
78,057 |
74,125 |
73,405 |
7000251098556183300♠+2.51% |
7000900756079286150♠+9.01% |
| 68 |
Newmarket |
Ontario |
Town |
38.3 km2 |
79,978 |
74,295 |
65,788 |
57,125 |
7000764923615317320♠+7.65% |
7001400052516411380♠+40.01% |
| 69 |
Brossard |
Quebec |
Ville |
45.2 km2 |
79,273 |
71,154 |
65,026 |
65,927 |
7001114104618152180♠+11.41% |
7001202436027727640♠+20.24% |
| 70 |
Peterborough |
Ontario |
City |
63.8 km2 |
78,698 |
74,898 |
71,446 |
69,742 |
7000507356671740230♠+5.07% |
7001128416162427229♠+12.84% |
| 71 |
Chilliwack |
British Columbia |
City |
261.5 km2 |
77,936 |
69,217 |
62,567 |
60,186 |
7001125966164381580♠+12.60% |
7001294919084172400♠+29.49% |
| 72 |
Maple Ridge |
British Columbia |
District municipality |
266.8 km2 |
76,052 |
68,949 |
63,169 |
56,173 |
7001103018172852400♠+10.30% |
7001353888878998810♠+35.39% |
| 73 |
Sault Ste. Marie |
Ontario |
City |
223.3 km2 |
75,141 |
74,948 |
74,566 |
80,054 |
6999257511874899930♠+0.26% |
2999386289254753040♠−6.14% |
| 74 |
Kawartha Lakes |
Ontario |
City |
3,083.1 km2 |
73,214 |
74,561 |
69,179 |
67,926 |
2999819342551736160♠−1.81% |
7000778494243735830♠+7.78% |
| 75 |
Sarnia |
Ontario |
City |
164.7 km2 |
72,366 |
71,419 |
70,876 |
72,738 |
7000132597768100930♠+1.33% |
3000488575435123320♠−0.51% |
| 76 |
Prince George |
British Columbia |
City |
318.3 km2 |
71,974 |
70,981 |
72,406 |
75,510 |
7000139896592045760♠+1.40% |
2999531717653290960♠−4.68% |
| 77 |
Drummondville |
Quebec |
Ville |
246.9 km2 |
71,852 |
67,392 |
63,029 |
58,588 |
7000661799620132950♠+6.62% |
7001226394483511980♠+22.64% |
| 78 |
Saint John |
New Brunswick |
City |
315.8 km2 |
70,063 |
68,043 |
69,661 |
72,494 |
7000296871096218570♠+2.97% |
2999664661903054050♠−3.35% |
| 79 |
Moncton |
New Brunswick |
City |
141.2 km2 |
69,074 |
64,128 |
61,046 |
59,313 |
7000771269960079840♠+7.71% |
7001164567632728070♠+16.46% |
| 80 |
Saint-Jérôme |
Quebec |
Ville |
90.5 km2 |
68,456 |
63,729 |
59,614 |
59,533 |
7000741734532159610♠+7.42% |
7001149883258024960♠+14.99% |
| 81 |
New Westminster |
British Columbia |
City |
15.6 km2 |
65,976 |
58,549 |
54,656 |
49,350 |
7001126851013680850♠+12.69% |
7001336899696048630♠+33.69% |
| 82 |
Wood Buffalo |
Alberta |
Specialized municipality |
63,637.5 km2 |
65,565 |
51,496 |
41,445 |
35,213 |
7001273205685878510♠+27.32% |
7001861954391843920♠+86.20% |
| 83 |
Granby |
Quebec |
Ville |
152.7 km2 |
63,433 |
47,637 |
44,121 |
43,316 |
7001331590990196700♠+33.16% |
7001464424231230950♠+46.44% |
| 84 |
Norfolk County |
Ontario |
City |
1,607.6 km2 |
63,175 |
62,563 |
60,847 |
60,534 |
6999978213960328000♠+0.98% |
7000436283741368490♠+4.36% |
| 85 |
St. Albert |
Alberta |
City |
48.3 km2 |
61,466 |
57,719 |
53,081 |
46,888 |
7000649179646217020♠+6.49% |
7001310911107319570♠+31.09% |
| 86 |
Medicine Hat |
Alberta |
City |
112.0 km2 |
60,005 |
56,997 |
51,249 |
46,783 |
7000527747074407430♠+5.28% |
7001282624030096400♠+28.26% |
| 87 |
Caledon |
Ontario |
Town |
688.2 km2 |
59,460 |
57,050 |
50,605 |
39,893 |
7000422436459246280♠+4.22% |
7001490487052866420♠+49.05% |
| 88 |
Halton Hills |
Ontario |
Town |
276.3 km2 |
59,008 |
55,289 |
48,184 |
42,390 |
7000672647362043080♠+6.73% |
7001392026421325780♠+39.20% |
| 89 |
Port Coquitlam |
British Columbia |
City |
29.2 km2 |
56,342 |
52,687 |
51,257 |
46,682 |
7000693719513352440♠+6.94% |
7001206932008054500♠+20.69% |
| 90 |
Fredericton |
New Brunswick |
City |
131.7 km2 |
56,224 |
50,535 |
47,580 |
46,507 |
7001112575442762440♠+11.26% |
7001208936289160770♠+20.89% |
| 91 |
Grande Prairie |
Alberta |
City |
72.8 km2 |
55,032 |
47,076 |
36,983 |
31,353 |
7001169003313790470♠+16.90% |
7001755238733135590♠+75.52% |
| 92 |
North Bay |
Ontario |
City |
319.1 km2 |
53,651 |
53,966 |
52,771 |
54,332 |
3000416299151317499♠−0.58% |
2999874659500846650♠−1.25% |
| 93 |
Blainville |
Quebec |
Ville |
55.1 km2 |
53,510 |
46,493 |
36,029 |
29,603 |
7001150925945841310♠+15.09% |
7001807587068878150♠+80.76% |
| 94 |
Saint-Hyacinthe |
Quebec |
Ville |
188.7 km2 |
53,236 |
51,616 |
50,394 |
50,027 |
7000313856168629880♠+3.14% |
7000641453615047870♠+6.41% |
| 95 |
Aurora |
Ontario |
Town |
49.8 km2 |
53,203 |
47,629 |
40,167 |
34,857 |
7001117029540825970♠+11.70% |
7001526321829187820♠+52.63% |
| 96 |
Welland |
Ontario |
City |
81.1 km2 |
50,631 |
50,331 |
48,402 |
48,411 |
6999596054121714260♠+0.60% |
7000458573464708430♠+4.59% |
| 97 |
Shawinigan |
Quebec |
Ville |
733.5 km2 |
50,060 |
51,904 |
52,040 |
56,721 |
2999644728729963010♠−3.55% |
2998882565540099790♠−11.74% |
| 98 |
Dollard-des-Ormeaux |
Quebec |
Ville |
15.1 km2 |
49,637 |
48,930 |
48,206 |
47,826 |
7000144492131616600♠+1.44% |
7000378664324844230♠+3.79% |
| 99 |
Belleville |
Ontario |
City |
247.2 km2 |
49,454 |
48,821 |
46,029 |
46,195 |
7000129657319596070♠+1.30% |
7000705487606883860♠+7.05% |
| 100 |
North Vancouver |
British Columbia |
City |
11.8 km2 |
48,196 |
45,165 |
44,303 |
41,475 |
7000671094874349610♠+6.71% |
7001162049427365880♠+16.20% |
.jpg)
.jpg)
.jpg)
.jpg)