Demography of Luton
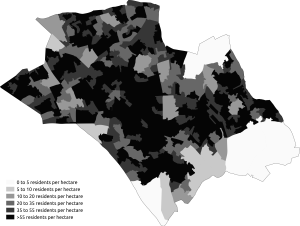
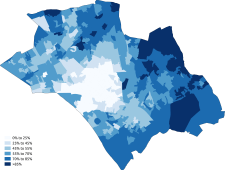
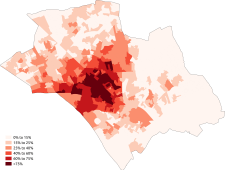
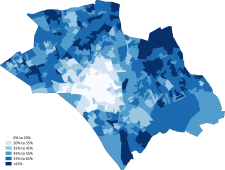
Population density in the 2011 census in Luton.
Luton, England is an ethnically and culturally diverse large town.
Population
Luton's total population, according to the 2011 UK census, was 203,201. The population density was 4,696 people per square km.
Ethnicity
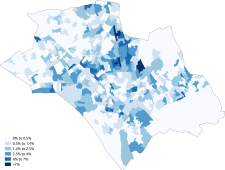
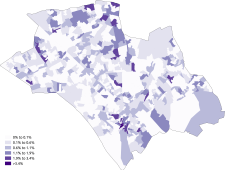
The following table shows the ethnic group of respondents in the 2001 and 2011 censuses in Luton.
| Ethnic Group |
2001[1] |
2011[2] |
| Number |
% |
Number |
% |
| White: British | 119,793 | 64.97% | 90,530 | 44.55% |
| White: Irish | 8,569 | 4.65% | 6,126 | 3.01% |
| White: Gypsy or Irish Traveller[note 1] | | | 198 | 0.10% |
| White: Other | 4,204 | 2.28% | 14,225 | 7.00% |
| White: Total | 132,566 | 71.90% | 111,079 | 54.66% |
| Asian or Asian British: Indian | 7,538 | 4.09% | 10,625 | 5.23% |
| Asian or Asian British: Pakistani | 17,012 | 9.23% | 29,353 | 14.45% |
| Asian or Asian British: Bangladeshi | 7,641 | 4.14% | 13,606 | 6.70% |
| Asian or Asian British: Chinese[note 2] | 1,096 | 0.59% | 1,497 | 0.74% |
| Asian or Asian British: Other Asian | 1,486 | 0.81% | 5,871 | 2.89% |
| Asian or Asian British: Total | 34,773 | 18.86% | 60,952 | 30.00% |
| Black or Black British: Caribbean | 7,653 | 4.15% | 8,177 | 4.02% |
| Black or Black British: African | 3,204 | 1.74% | 9,169 | 4.51% |
| Black or Black British: Other Black | 827 | 0.45% | 2,563 | 1.26% |
| Black or Black British: Total | 11,684 | 6.34% | 19,909 | 9.80% |
| Mixed: White and Black Caribbean | 2,414 | 1.31% | 3,831 | 1.89% |
| Mixed: White and Black African | 389 | 0.21% | 915 | 0.45% |
| Mixed: White and Asian | 1,058 | 0.57% | 1,805 | 0.89% |
| Mixed: Other Mixed | 867 | 0.47% | 1,730 | 0.85% |
| Mixed: Total | 4,728 | 2.56% | 8,281 | 4.08% |
| Other: Arab[note 3] | | | 1,646 | 0.81% |
| Other: Any other ethnic group | 620 | 0.34% | 1,334 | 0.66% |
| Other: Total | 620 | 0.34% | 2,980 | 1.47% |
| Total | 184,371 | 100.00% | 203,201 | 100.00% |
Notes for table above
- ↑ New category created for the 2011 census
- ↑ In 2001, listed under the 'Chinese or other ethnic group' heading.
- ↑ New category created for the 2011 census
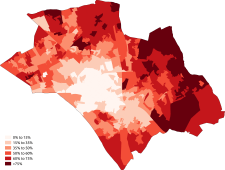
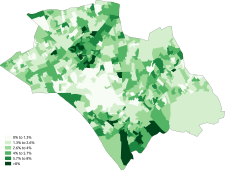
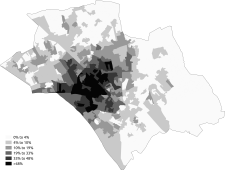
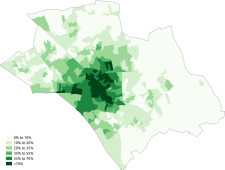
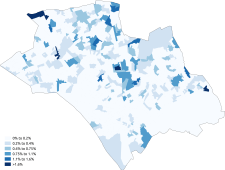
| Distribution of ethnic groups in Luton according to the 2011 census. |
|---|
|
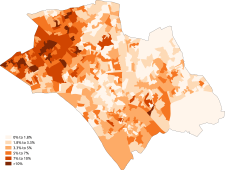
Languages
The most common main languages spoken in Luton according to the 2011 census are shown below.[3]
Religion
The following table shows the religion of respondents in the 2001 and 2011 censuses in Luton.
| Religion |
2001[4] |
2011[5] |
| Number |
% |
Number |
% |
| Christian | 109,973 | 59.65% | 96,271 | 47.38% |
| Buddhist | 456 | 0.25% | 652 | 0.32% |
| Hindu | 5,025 | 2.73% | 6,749 | 3.32% |
| Jewish | 534 | 0.29% | 326 | 0.16% |
| Muslim | 26,963 | 14.62% | 49,991 | 24.60% |
| Sikh | 1,487 | 0.81% | 2,347 | 1.16% |
| Other religion | 642 | 0.35% | 898 | 0.44% |
| No religion | 25,960 | 14.08% | 33,594 | 16.53% |
| Religion not stated | 13,331 | 7.23% | 12,373 | 6.09% |
| Total | 184,371 | 100.00% | 203,201 | 100.00% |
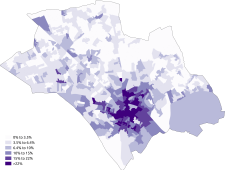
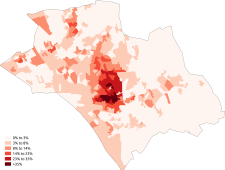
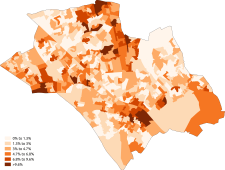
| Distribution of religions in Luton according to the 2011 census. |
|---|
|
See also
References
|
|---|
|
England Portal |
|
| Unitary authorities | |
|---|
|
| Major settlements | |
|---|
|
| Topics | |
|---|