Demography of Bradford

Population density in the 2011 census in the Bradford Metropolitan District Council area.
Bradford, England is an ethnically and culturally diverse city. It is the sixth most populous city in the United Kingdom.
Population
Bradford's total population, according to the 2011 UK census, was 522,452. The population density was 1,428 people per square km.
Ethnicity
The following table shows the ethnic group of respondents in the 2001 and 2011 censuses in Bradford.
| Ethnic Group |
2001[1] |
2011[2] |
| Number |
% |
Number |
% |
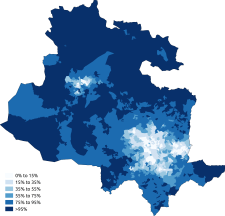
| White: British | 355,684 | 76.06% | 333,628 | 63.86% |
| White: Irish | 3,479 | 0.74% | 2,541 | 0.49% |
| White: Gypsy or Irish Traveller[note 1] | | | 433 | 0.08% |
| White: Other | 6,878 | 1.47% | 15,715 | 3.01% |
| White: Total | 366,041 | 78.27% | 352,317 | 67.44% |
| Asian or Asian British: Indian | 12,504 | 2.67% | 13,555 | 2.59% |
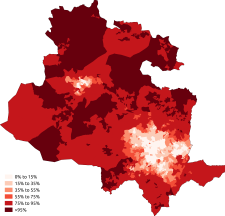
| Asian or Asian British: Pakistani | 67,994 | 14.54% | 106,614 | 20.41% |
| Asian or Asian British: Bangladeshi | 4,967 | 1.06% | 9,863 | 1.89% |
| Asian or Asian British: Chinese[note 2] | 896 | 0.19% | 2,086 | 0.40% |
| Asian or Asian British: Other Asian | 2,932 | 0.63% | 8,031 | 1.54% |
| Asian or Asian British: Total | 89,293 | 19.09% | 140,149 | 26.83% |
| Black or Black British: Caribbean | 3,038 | 0.65% | 3,581 | 0.69% |
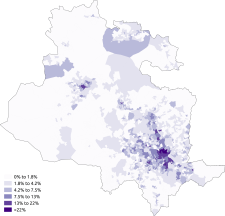
| Black or Black British: African | 970 | 0.21% | 4,993 | 0.96% |
| Black or Black British: Other Black | 325 | 0.07% | 693 | 0.13% |
| Black or Black British: Total | 4,333 | 0.93% | 9,267 | 1.77% |
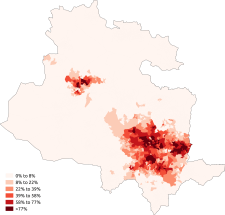
| Mixed: White and Black Caribbean | 2,611 | 0.56% | 4,663 | 0.89% |
| Mixed: White and Black African | 449 | 0.10% | 875 | 0.17% |
| Mixed: White and Asian | 2,926 | 0.63% | 5,677 | 1.09% |
| Mixed: Other Mixed | 951 | 0.20% | 1,764 | 0.34% |
| Mixed: Total | 6,937 | 1.48% | 12,979 | 2.48% |
| Other: Arab[note 3] | | | 3,714 | 0.71% |
| Other: Any other ethnic group | 1,061 | 0.23% | 4,026 | 0.77% |
| Other: Total | 1,061 | 0.23% | 7,740 | 1.48% |
| Total | 467,665 | 100.00% | 522,452 | 100.00% |
Notes for table above
- ↑ New category created for the 2011 census
- ↑ In 2001, listed under the 'Chinese or other ethnic group' heading.
- ↑ New category created for the 2011 census
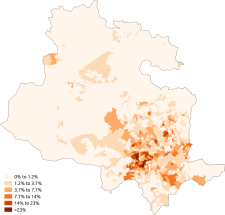
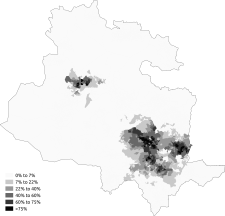
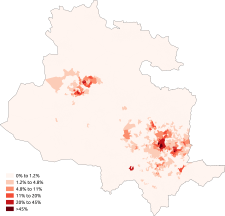
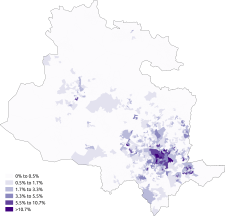
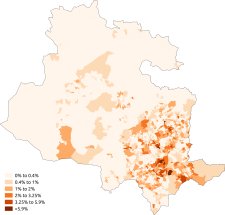
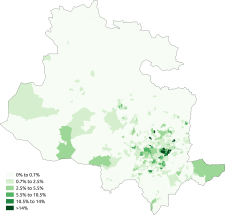
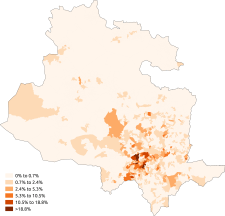
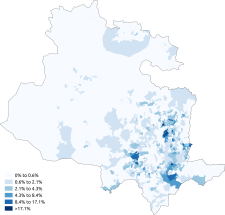
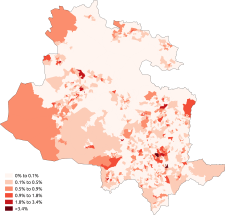
| Distribution of ethnic groups in the Bradford Metropolitan District Council area according to the 2011 census. |
|---|
|
Languages
The most common main languages spoken in Bradford according to the 2011 census are shown below.[3]
| Rank | Language | Usual residents aged 3+ | Proportion |
| 1 | English | 424,527 | 85.31% |
| 2 | Punjabi | 19,842 | 3.99% |
| 3 | Urdu | 16,550 | 3.33% |
| 4 | Polish | 5,526 | 1.11% |
| 5 | Bengali (with Sylheti and Chatgaya) | 4,743 | 0.95% |
| 6 | Pashto | 3,580 | 0.72% |
| 7 | Gujarati | 2,638 | 0.53% |
| 8 | Arabic | 2,398 | 0.48% |
| 9 | Slovak | 2,162 | 0.43% |
| 10 | Kurdish | 1,275 | 0.26% |
| 11 | Pakistani Pahari (with Mirpuri and Potwari) | 1,048 | 0.21% |
| 12 | Latvian | 985 | 0.20% |
| 13 | Russian | 690 | 0.14% |
| 14 | Czech | 642 | 0.13% |
| 15 | Tagalog/Filipino | 640 | 0.13% |
| 16 | Persian/Farsi | 592 | 0.12% |
| 17 | Italian | 564 | 0.11% |
| 18 | French | 443 | 0.09% |
| 19 | Lithuanian | 436 | 0.09% |
| 20 | Greek | 382 | 0.08% |
| | Other | 7,945 | 1.60% |
Religion
The following table shows the religion of respondents in the 2001 and 2011 censuses in Bradford.
| Religion |
2001[4] |
2011[5] |
| Number |
% |
Number |
% |
| Christian | 281,236 | 60.14% | 239,843 | 45.91% |
| Buddhist | 537 | 0.11% | 1,000 | 0.19% |
| Hindu | 4,457 | 0.95% | 4,882 | 0.93% |
| Jewish | 356 | 0.08% | 299 | 0.06% |
| Muslim | 75,188 | 16.08% | 129,041 | 24.70% |
| Sikh | 4,748 | 1.02% | 5,125 | 0.98% |
| Other religion | 996 | 0.21% | 1,686 | 0.32% |
| No religion | 62,226 | 13.31% | 108,027 | 20.68% |
| Religion not stated | 37,921 | 8.11% | 32,549 | 6.23% |
| Total | 467,665 | 100.00% | 522,452 | 100.00% |
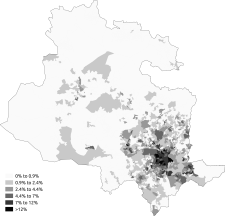
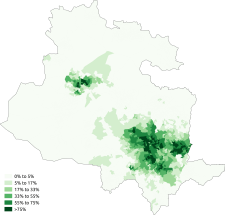
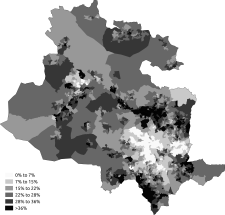
| Distribution of religions in the Bradford Metropolitan District Council area according to the 2011 census. |
|---|
|
See also
References
|
|---|
|
Yorkshire Portal |
|
| Metropolitan districts | |
|---|
|
| Major settlements | |
|---|
|
| Topics | |
|---|